Introduction
Should you use a two-tailed test or a one-tailed test (or similarly, a confidence interval or 1-sided confidence bound)? For those just learning statistics, or who have had only a little training in the subject, this question comes up fairly often. And there is some conflicting information and advice out there. Most often I’ve seen comments critical of one-sided methods, such as:
The short answer is: Never use one tailed tests. - The Analysis Factor
or
Two-Tailed Tests are the Default Choice - Statistics by Jim
Though I did come across at least one person I’ve seen suggests the opposite!
I actually intend to go all the way and argue that barring some very narrow use-cases, one should never use a two-tailed statistical test. - Analytics Toolkit blog
I disagree with all of these statements to varying degrees, though mostly the first and the third. In this post, I’ll try to clarify how to think about this so that you can know whether to use a 1-sided or 2-sided test (spoiler: It has nothing little to do with Statistics). As an aside, “1-tailed” and “2-sided” are interchangable terms, and for the 1-tailed methods, there can be upper-tail or lower-tail.
Crash course on hypothesis testing
Understanding 1- or 2-tailed methods is probably easiest to describe in terms of hypothesis testing, but the same concepts apply to interval estimation (instead of, e.g., a confidence interval, you can construct a 1-sided confidence bound). So to start off, I’ll give a very short summary of basic hypothesis testing. I’m going to focus on a 1-sample t-test, but the same ideas will apply to any situation where you can have two tails. If you already understand t-tests, you probably want to skip to the next section.
Step 1: Define your null and alternative hypotheses. Here are two such sets, for an upper-tail and two-tailed test, respectively, on the mean.
- Upper tailed: \(H_{o}: \mu \leq \mu_{0}\) vs \(H_{a}: \mu > \mu_{0}\)
- Two tailed: \(H_{o}: \mu = \mu_{0}\) vs \(H_{a}: \mu \ne \mu_{0}\)
In these, \(\mu_{0}\) is some hypothesized value, some value we are interested in comparing against.
Step 2: Select a significance level, denoted by \(\alpha\). This is the probability of committing a Type I error. This is the event in which we reject the null hypothesis when we should not have, because the null hypothesis is actually true. Any probability can be selected here, some common values are 0.1, 0.05, and 0.01. In practice we will not know whether or not a commit a Type I error.
Step 3: From the data, compute the test statistic which (under certain assumptions) will follow a particular sampling distribution. One of the most basic examples is the t-test, where the test statistic is \(t = (\bar{x} - \mu_{0}) / (s / \sqrt{n} )\) will follow a t-distribution (assuming the conditions are satisfied).
Step 4: We then put this test statistic on the t-distribution and see if it falls into the rejection region (RR). This RR is determined from the significance level, depending on how the alternative hypothesis is specified. For an upper-tail test, all of the \(\alpha\) probability is piled into the upper tail. For a two-tailed test, the α probability is split between the two tails. I made a graphic to illustrate this.
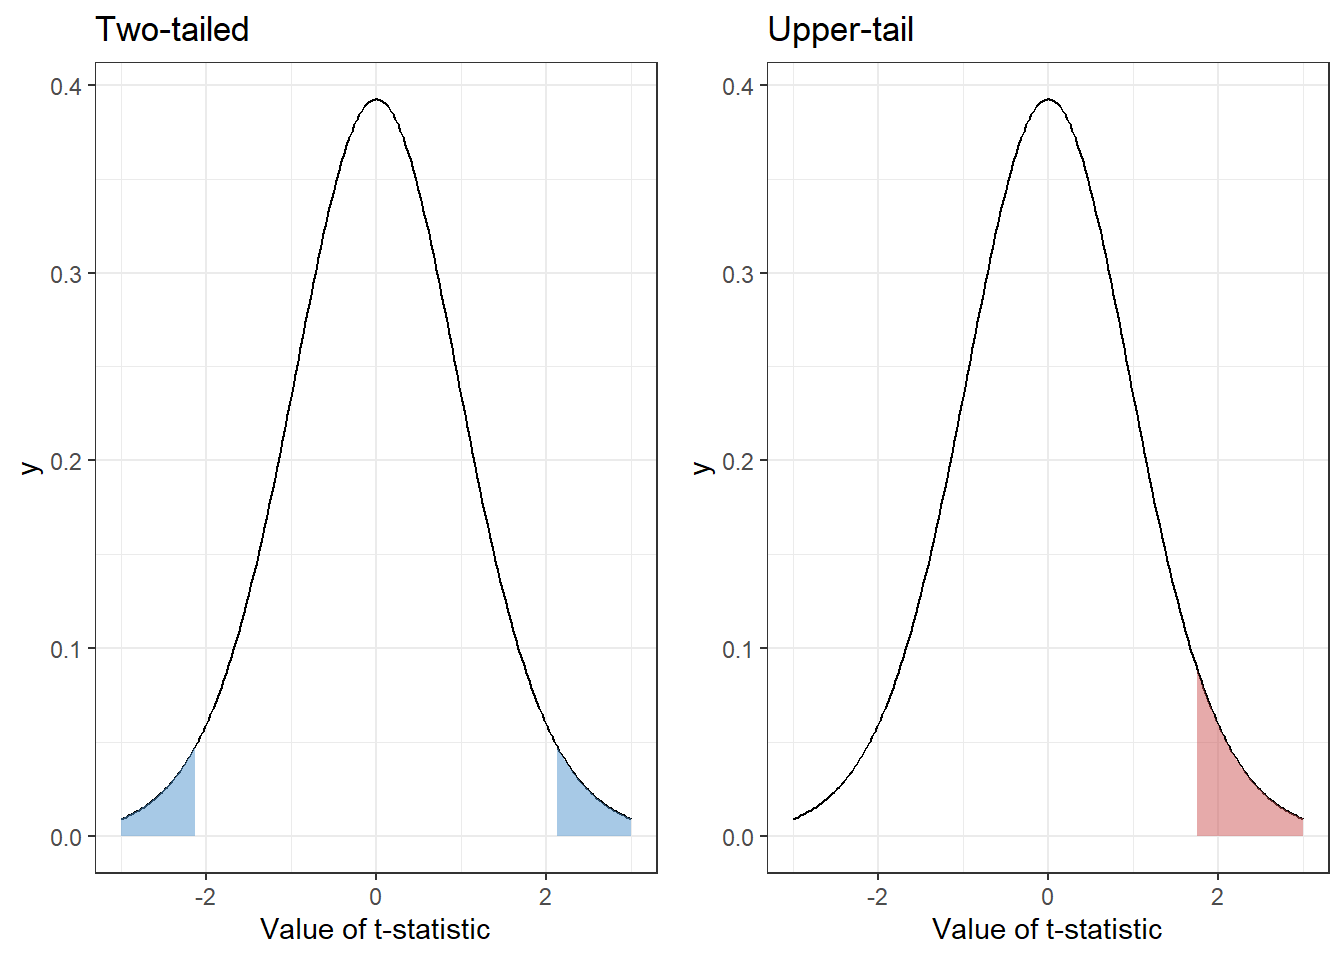
For each figure, the shaded region represents 5% of the total area. But we have arranged that 5% differently, because the tests are answering different questions.
Step 5: Reject or fail to reject the null hypothesis. From that decision, you’d then take appropriate action - or not. I’ll provide a couple examples further on.
If you’re more familiar with p-values or critical values, do not fear. There’s a 1-1 correspondence between these. The RR is bounded by the critical value, which is the value at which the tail probability is equal to \(\alpha\). Hence:
If the test statistic is in the rejection region (\(t \in RR\)), then \(p \leq \alpha\)
How to choose 1 or 2 tails
Okay, so that was a very quick overview of hypothesis testing. Then we come to the question of whether we should use a 1-tailed or 2-tailed method. To understand this, we need to understand what we’re actually doing when testing a hypothesis. Usually, we arrange the hypotheses so that the alternative hypothesis represents an actionable event, and the null hypothesis is the “status quo.” This means that when we reject the null hypothesis, we’re going to do something. I read and comment on the subreddits r/statistics and r/AskStatistics (among others). There, I think a user with the handle The_Sodomister phrased it well: Rejecting the null hypothesis means we “take action.” On the other hand, failing to reject the null hypothesis means we do not take action.
So we need to consider the context of the data, and whether we care about the direction. Let’s consider a couple of examples.
Airlines regularly overbook flights (sell more tickets than they have seats). But for various reasons, not everyone shows up for their flight, so it often balances out. What they really care about is how many people show up, since too many people showing up means they have to pay out to reimburse anyone who can’t board that flight. So if they find that too many people will show up, they’ll take action by overbooking to a smaller degree. However, if too few people show up, well, those people paid for their ticket anyway, so the airline isn’t really losing out (that being said, they could be interested in the lower bound, so that they can overbook even further!).
A pharmaceutical company is developing a new drug as an alternative to an existing drug. They’re doing the science to try to improve upon the existing drug, so they’d like to see improved outcomes. But it is extremely important to know if the new treatment actually leads to worse outcomes. So even though the company wants to show an effect in a particular direction, they also need to be able to detect if the effect is in the opposite direction. So the company will take action in either case (push the drug to market, or end R&D on the drug). So a two-tailed test would be of interest.
An engineer is designing a critical component for a rocket to send astronauts into space. That component has some failure rate, and a failure would mean the loss of millions or billions of dollars, and possibly lead to the death of the astronauts. Since this component was carefully designed and manufactured, the plan is to use it unless the error rate is too high. So the engineer is really only interested in the upper tail, how larger might the failure rate be, rather than how low it might be; they essentially treat the upper bound as “It’s possible for the error rate to be as large as X%, so we’re going to assume it is X%.” The question then fundamentally becomes “Is X% too high?”
An individual is considering whether to buy more of a particular stock, so they look at the average daily returns. They are interested if the daily return is positive, since they would then like to buy more. However, if the daily return is negative, that probably would lead to an action as well (say, selling that stock). Hence, detecting an effect in both directions is important.
To conduct a 1-tailed test, the opposite tail needs to be of utterly no concern. In the stock example, we would have to not care at all if the stock’s price was negative. There’s a good chance that’s not the case. That said, I’m no economist. Maybe for a prospective investor who doesn’t own any stock yet, their default position would be “Don’t invest,” so they really don’t care if the returns are negative, they’re only going to take action if the returns are positive.
What’s important is specifying up-front what question we are interested in answering, and what results would cause us to take action. These should be clarified before data is collected. The statistical hypotheses and direction of the method are consequences of the answers. So as I hinted at before: This isn’t really really part of the statistical method, it’s part of the research hypothesis. This means it’s a subject-matter issue more than it is a statistical issue.
If we only take action for a particular direction, then we should only be testing in that direction. If we would take action for both directions, then we should test in both directions. The statistical part of this is, in my opinion, simply translating the question of interest from English (or whatever your language of choice might be) into statistical terms, such as be proposing a statistical model and rephrasing the question in terms of statistical parameters.
So I guess my take-away or tl;dr for this would be:
If you only care about (or would only take action) for results in a particular direction, then only test in that direction.
Trailing thoughts
There are a few comments I want to make that I didn’t find a good place to work into the above discussion.
One of the quotes that I started off with said that two-tailed tests should be the default. The reason I disagree with this is that I don’t think there should be a “default” and an “exception.” I think we should carefully assess the context, but not be predisposed to one or the other.
This whole discussion only applies to a subset of statistical methods. Some methods, such as Analysis of Variance (ANOVA) are inherently 2-tailed. However, there are some directional variants, broadly described as tests for ordered alternatives, which put a series of inequalities (\(\leq\) or \(\geq\)) into the alternative hypothesis.
- An old and reasonably well-known one is the Jonckheere–Terpstra test, which modifies a nonparametric ANOVA for the case of ordered alternatives.
- For some shameless self-promotion, some of my research has been on the subject of ordered alternatives. See for example the papers on which I am co- or lead-author, Davidov, Jelsema, & Peddada (2018) and Jelsema & Peddada (2016). In addition, a doctoral student I worked with at WVU used these methods in two applied papers, Law, Morris, & Jelsema (2017) and Law, Morris, & Jelsema (2018)