Introduction
This is part 2 a 3-part bit on voting and elections.
As before, the disclaimer that I’m not a political scientist, I am not an expert on the constitution or any other relevant field. I’m commenting here just as an individual. Also, a reminder that CGP Grey’s videos Politics in the Animal Kingdom are fantastic, and a much better explanation that I give here.
Alternative voting systems
In Voting Methods Part 1 I talked about FPTP / plurality and some problems such as gerrymandering that can arise. So if we don’t want a system like that, what are some alternative methods that might address these problems?
Ranked choice voting
Currently, most Americans vote by selecting one candidate from a set as “The person they vote for.” But that’s not the only way to go about it. Think back to the example with Calvin, Hobbes, and Suzie - every Suzie voter preferred Hobbes over Calvin. We could then say that their preference order was: Suzie -> Hobbes -> Calvin. So they could fill out their ballot by ranking these candidates, e.g.
Rank | Candidate |
3 | Calvin |
2 | Hobbes |
1 | Suzie |
This way, when counting ballots, if the voter’s preferred candidate (in this case, Suzie) does not win, their vote goes to the second most preferred candidate, in this case Hobbes. In this way, it guards against the “wasted vote” because if you vote for someone who has a low chance of winning (like a third party), your vote will still contribute to who ultimately wins the election.
There are multiple ways to tally the votes. One way is known as the Borda count (though there are actual multiple ways to implement a Borda count). In the Borda count, each position is assigned some number of points. For a 3-person race, we might assign 3 points for a 1st-place rank, 2 points for a 2nd-place rank, and 1 point for a 3rd-place rank.
Borda count: Example 1
Going back to the example, we’d have a situation that looks like this:
Votes | CHS | HSC | SHC |
Proportion | 40% | 35% | 25% |
Rank 1 | Calvin | Hobbes | Suzie |
Rank 2 | Hobbes | Suzie | Hobbes |
Rank 3 | Suzie | Calvin | Calvin |
This may seem a bit odd. The three columns at the right denote the three unique rankings of candidates that were cast. There are three more possible orders of the preference ranking, which I’ll consider in a second example. The numbers at the top represent the proportion of voters who cast a ballot with that order.
For now, I’ve just extended the votes so that:
- All of Calvin’s voters prefer Hobbes to Suzie
- All of Hobbes’ voters prefer Suzie to Calvin.
- All of Suzie’ voters prefer Hobbes to Calvin.
We can see this as a split vote on one side, creating a “spoiler effect.”
Just by inspection, we can kind of see that Hobbes is a more broadly popular candidate, right? He’s ranked 1st or 2nd, while Calvin has only 1st and 3rd place votes. Applying the Borda count would be a weighted average of the points (1st = 3 points, 2nd = 2 points, 3rd = 1 point), using the proportion of votes at each rank as the weight. For example, to get Suzie’s borda count, we took a weighted average of the ranks:
\[ BC_{S} = (0.40 \times 1) + (0.35 \times 2) + (0.25 \times 3) \] Applying the same to all of the candidates, we would get the following results:
Candidate | Count |
Calvin | 1.80 |
Hobbes | 2.35 |
Suzie | 1.85 |
And so Hobbes would be declared the winner of the election.
Borda count: Example 2
Going to a slightly more complex ballot, let’s say that Calvin and Suzie are the “extreme” candidates, while Hobbes is a more centrist candidate. So Hobbes’ voters second choice are a bit more split, but Suzie’s and Calvin’s would primarily go to Hobbes.
Votes | CHS | CSH | HCS | HSC | SHC | SCH |
Proportion | 35% | 5% | 20% | 15% | 20% | 5% |
Rank 1 | Calvin | Calvin | Hobbes | Hobbes | Suzie | Suzie |
Rank 2 | Hobbes | Suzie | Calvin | Suzie | Hobbes | Calvin |
Rank 3 | Suzie | Hobbes | Suzie | Calvin | Calvin | Hobbes |
Then applying the Borda count, we would get:
Candidate | Count |
Calvin | 2.05 |
Hobbes | 2.25 |
Suzie | 1.70 |
So while Calvin is now a bit more popular than Suzie, Hobbes still wins the election.
Borda count: Example 3
One more example, just because I wrote a function to turn these ballots into a borda count, and I want to get my use out of it, let’s say that Hobbes is actually in last place when considering strictly first-place votes. To put that in real terms: People are voting for the “extreme” candidates of their party (Calvin with his G.R.O.S.S. club, Suzie with her tea parties), but have a more moderate/centrist as a backup choice (Hobbes just wants a tuna sandwich for everyone).
Votes | CHS | HCS | HSC | SHC |
Proportion | 45% | 5% | 5% | 45% |
Rank 1 | Calvin | Hobbes | Hobbes | Suzie |
Rank 2 | Hobbes | Calvin | Suzie | Hobbes |
Rank 3 | Suzie | Suzie | Calvin | Calvin |
So here, only 10% of voters put Hobbes first, while 90% voted for their preferred “extreme” candidate. But when we tally up the Borda count, we get:
Candidate | Count |
Calvin | 1.95 |
Hobbes | 2.10 |
Suzie | 1.95 |
So Hobbes still wins the day, because enough votes from either side thought he was an acceptable backup.
Using a Borda count isn’t the only way to tally ranked ballots, but it’s an example of how to better represent the desires of the voters compared to plurality.
Proportional representation
Another method that I, at least currently, am interested in is proportional representation. There are multiple ways to implement this, such as the Single Transferable Vote or Mixed-member proportional representation, and some of them can get a little complicated, but the basic idea is that the single-member districts gets pooled together, and the representatives are allocated to (approximately) align with the result of the vote.
One simple (possibly naive) way of implementing is to note how much percent of the population each representative is supposed to represent. If there are 10 representatives to elect, then to be elected, a candidate should need 10% of the vote. If no candidates get to the 10% threshold, then the least-popular candidate is removed and (using ranked voting) their votes would be transferred to their next ranked candidate. The CGP Grey video on Single Transferable Vote has a nice demonstration of this.
One very attractive feature of this this method is that it renders gerrymandering difficult or impossible, because there are no longer districts to be redrawn: All representatives are elected from a single “district”, the state (though I suppose it’s possible to have a couple multi-member districts for different regions of larger states like New York, California, Texas, etc). It also enables some more diversity, possibly allowing a third party to get a representative or two. For example, in California with it’s 53 house representatives, each represents approximately 1.9% of voters, so depending on the implementation, a party might earn a representative by getting a (very realistic) 2% of the vote (and if this system was implemented, the share of third-party votes could feasible increase).
STV: Example
Let’s say that a district needs 5 representatives - so each represents 20% of the vote - and the vote breakdown is shown below.
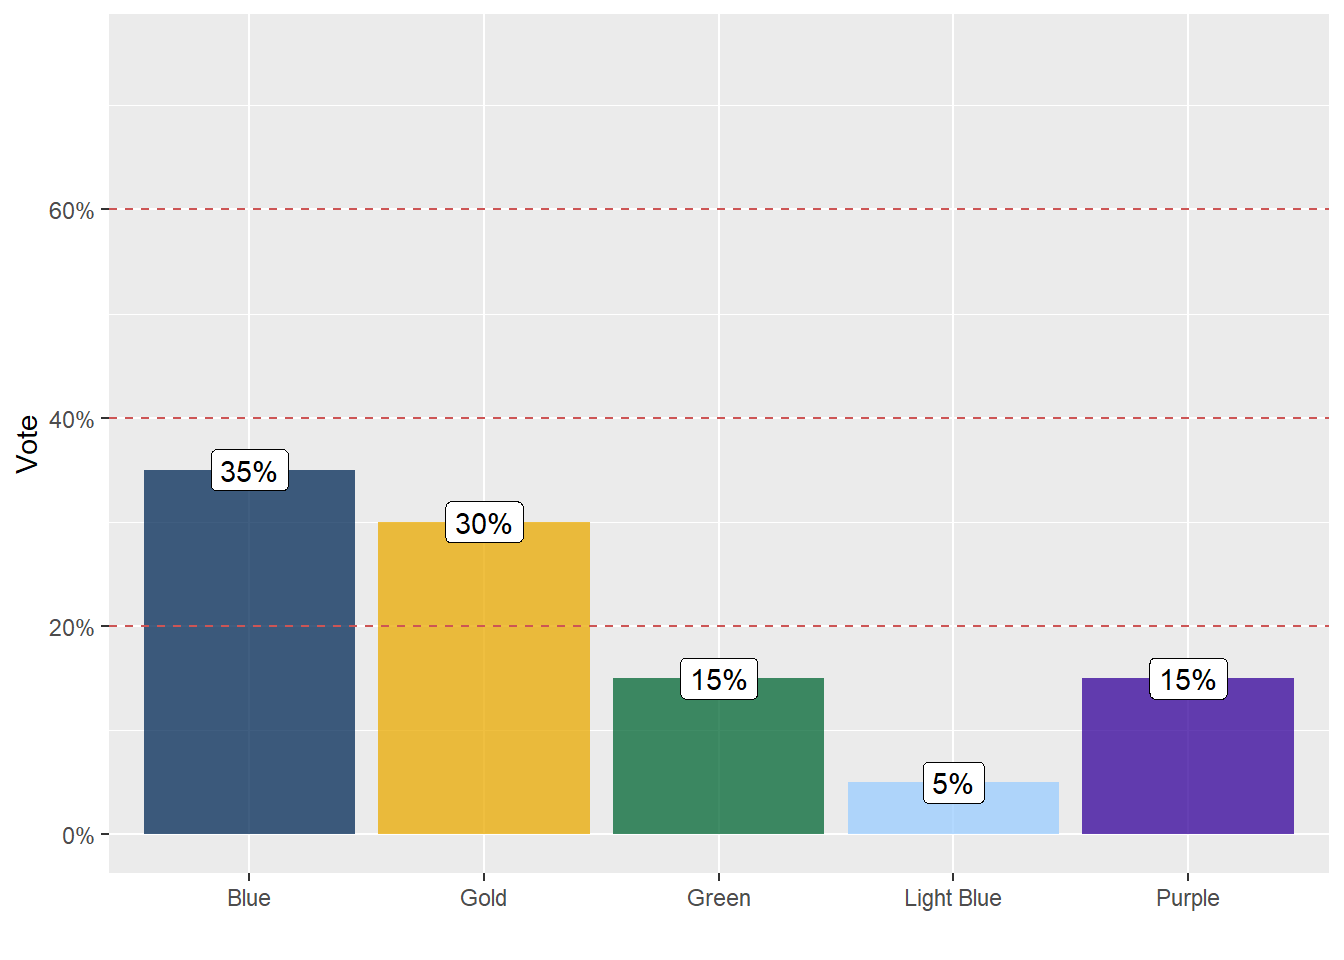
Clearly Blue and Gold get a representative, right? But then how are the other three representatives allocated? Nobody got 40%, so there’s not really an argument that Blue or Gold should get two representatives (yet). One way of going forward is to eliminate take the party that got the least votes and allocate them to their second choice. In this case, let’s say that Light Blue voters would have otherwise voted for Blue. So the new picture looks like:
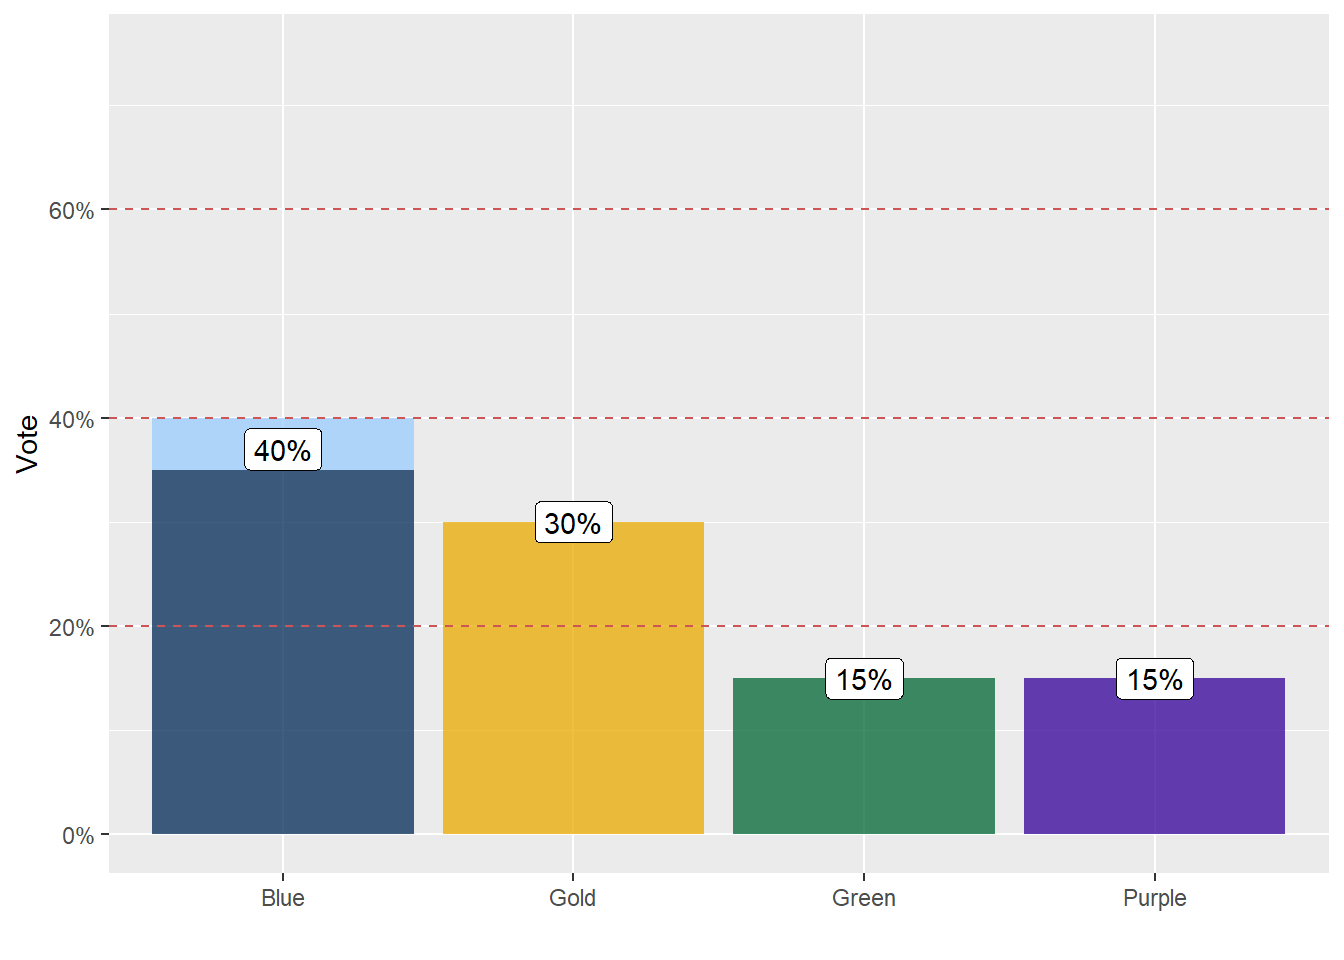
Now with 40% of the vote, it seems reasonable to give Blue two of the five representatives. But we still have two more, with Green and Purple being tied for last place. If they both would have opted for Gold otherwise, then we would add them to Gold’s tally, as shown below.
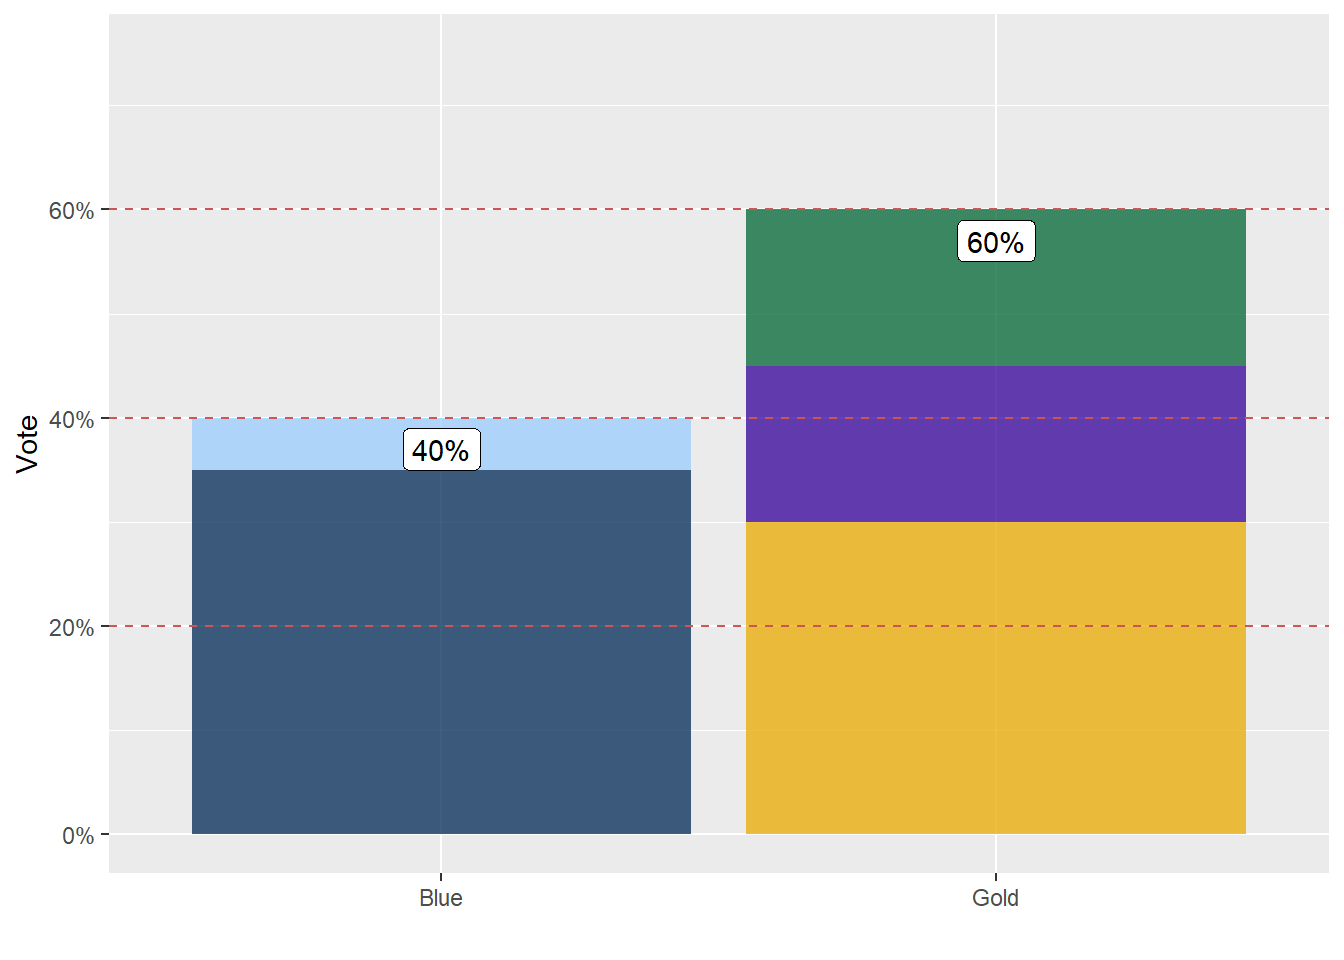
Now it seems rational to give Blue two representatives, and give Gold three representatives, thus proportionally allocating the representatives according to the actual vote of the people.
Now, you might say that if Green and Purple are “close” to each other, that they might instead group together and get a representative that’s more aligned with them rather than someone from Gold. That’s true. What I showed here is just one possible way to go about allocating representatives, and it’s knowingly a bit simplistic just to illustrate the point. There are more sophisticated methods for proportional allocation and STV which can help with this.
It’s also rather unlikely that vote tallies will wind up being so nicely aligned with whatever threshold is needed to claim one of the representatives, so there will be some degree of mismatch between the vote and the allocation of representatives. Generally speaking, the more representatives in a region (e.g., State), the more able the system is to reflect the makeup of the people.
Summary
In Voting Methods Part 1 I described plurality voting and some problems with it. Here in Part 2 I’ve talked a bit about some alternatives. These were both “background” for what I actually wanted to talk about in Voting Methods Part 3, some changes to the electoral process in the United States that I’d like to see.